Looking at Data like a City Street
Anyone who has been exposed to English-language children’s books in the last few decades should be familiar with the work of Richard Scarry. Despite his name, his delightful picture books are not at all frightening, and feature amusing illustrations of the anthropomorphic animals who live in the fictional city of Busytown. One of the most popular Richard Scarry books is “What do People Do all Day”, which features cutaway illustrations of places like the Bank, the Fire Station, the Real Estate office and other businesses in town, where a child can get a glimpse of what happens inside all of those brick and stone buildings.

What this book created in me was a lifelong fascination with cutaway illustrations. In these, you get a glimpse of a hidden world behind the façade of a building, or underneath our feet. This fascination with these types of illustrations is something that many others share, as they have been around for decades, for instance, in this delightful cutaway of a London street scene from 1883 by the French illustrator P.Broux, meant to show the passage of the then-new London Underground.

I love this illustration on multiple levels, first of all the delightful Victorian scene on the busy street, but also the fact that the passersby on that busy street were unaware of all the complexity and different types of transport that was happening just beneath their feet.
That hidden complexity is no less true of our own city streets today, in fact even more so as additional layers of pipes, wire and fibre-optic conduits and even additional layers of underground trains have been added that could not have been imagined by Victorian engineers. In fact, what I’ve been thinking about a lot is how this same cutaway model of a city street is a wonderful metaphor for the hidden complexity of how modern software-based systems work. The difference is that in systems design of this sort, what moves is not water, gas, or even electricity, but that more elusive and hard-to-define quantity — data.
So let’s go on a journey down a cutaway diagram, this time showing not a city street, but a typical enterprise data architecture. We’ll be descending down through the layers in the picture below:
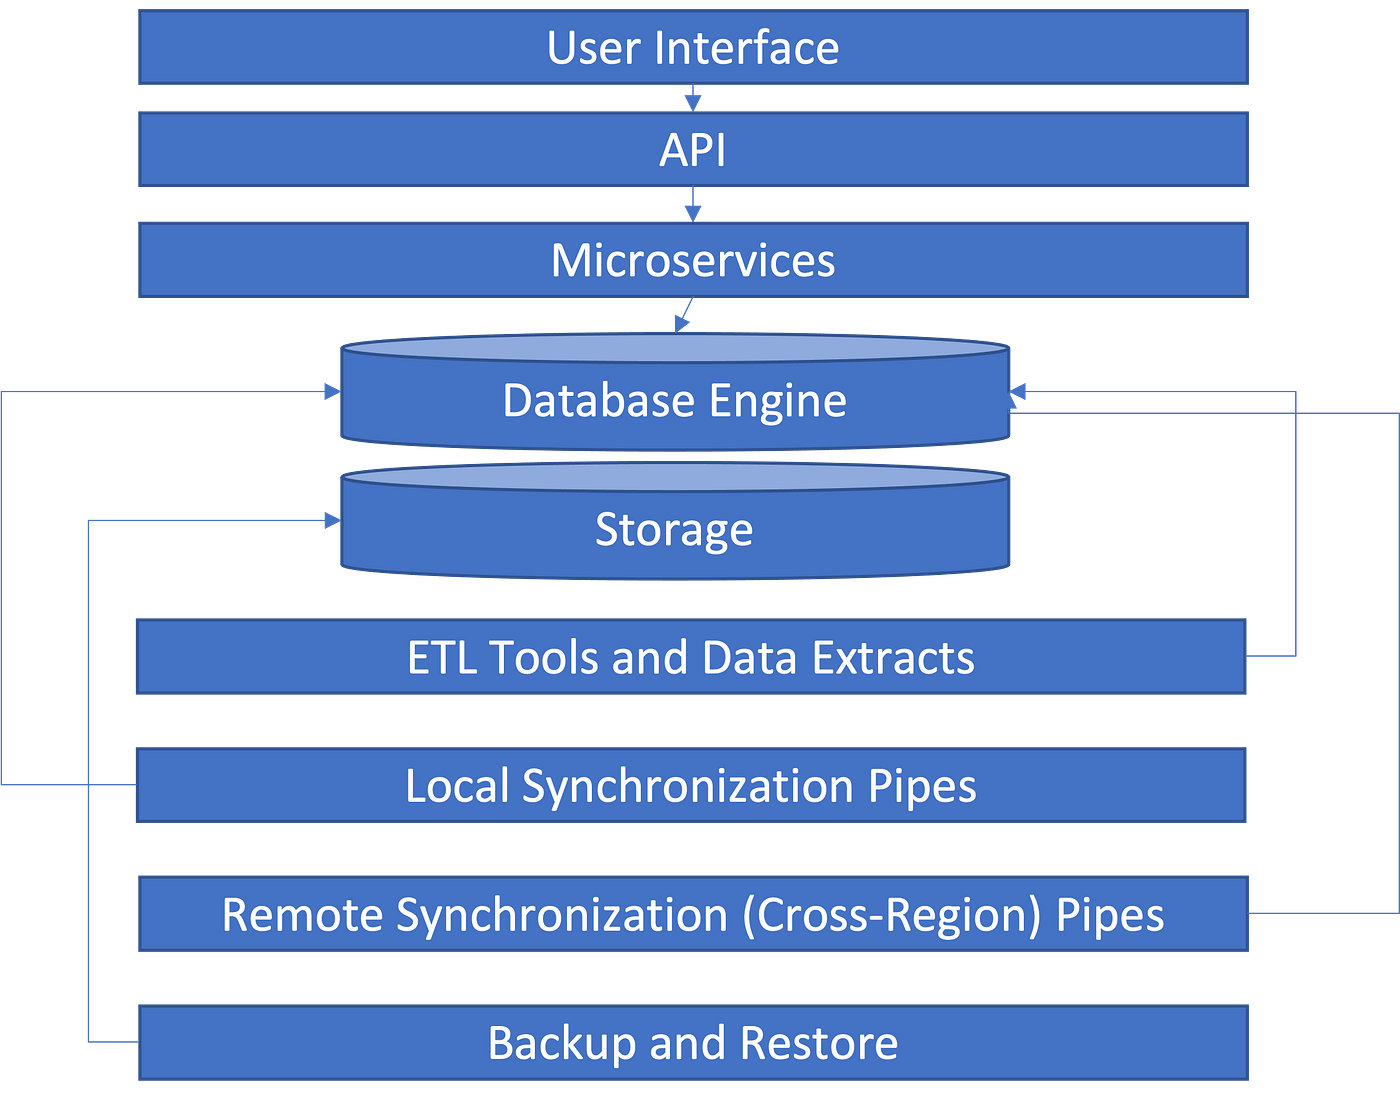
To show what I mean let’s start at the top of the diagram (and correspondingly with the top of the London city scene) with the obvious place you see data — at the user interface. Most of where you encounter data is at this layer — it’s where you enter it into forms or where you view it either as the result of queries or in more sophisticated analytics forms such as graphs or animations.
However, for our purposes, this is the least interesting layer. It’s like the street-level traffic of pedestrians and carriages moving by in the Victorian scene above — useful for reference, but only there for that purpose. But if we take a look under the street and think about the next layer down, then things start to get interesting. Just beneath any user interface is a layer of APIs in which data moves back and forth between the user interface (now usually running as JavaScript code in a browser) and the back-end programs that form the bulk of the application.
This is where much of the time goes in the design of a program, particularly one using the Microservices architecture, where APIs are ubiquitous. In a sense this is like the subway system shown in the diagram above. It gains a lot of attention when it goes wrong — many of the security breaches in modern systems happen at the API layer. Likewise, if your API’s go wrong, while the user interface continues to function, you will have a lot of very upset people as they are bombarded by unexpected and often poorly documented failure codes and error messages.
But as important as this layer is, and as much attention as it gets, it’s not the only data transport layer in your system, as much as many developers and architects like to think. Instead, much like the city cutaway, there are many other layers of data transport going on that a user, or even most developers, never encounter in their day-to-day work.
For instance, let’s consider another layer beneath the previous two. This is the layer that handles data extracts. Now what do we mean by that? In almost any modern system, the data that you enter into the system is only the most current data — the part that is being actively queried and updated. In most systems (particularly think about a retail system, or a system that perhaps takes in factory floor data from IOT devices) that data has a limited useful lifetime for these kinds of straightforward decisions, queries and updates. That is why it is often called Operational Data (and systems that work on it are then often called OLTP, Online Transactional Processing) systems.
The question then becomes, how big can these databases grow? Think about the number of sales receipts for a large clothing chain — over years of transactions across hundreds of stores, that could grow into hundreds of millions of records — only some of which are ever queried directly by the store systems themselves. All of the data that isn’t currently used for business processing is the domain of another type of system, the Online Analytical Processing System (OLAP). This used to be a hard and fast division, with different systems, tools, teams and groups being responsible for them, but in today’s world, with storage and compute costs very low, and functionality provided by cloud-based SaaS systems, the two worlds are increasingly difficult to separate.
In any case, if these are two different systems, or just two different databases used by the same system, you have to move the data out of the OLTP side and into the OLAP side. That is the job of ETL (Extract, Transform, Load) tools — they pull data out of operational databases and move it to data warehouses and data lakes. Modern cloud data warehouse and data lake services such as Snowflake and Amazon Redshift usually handle this as part of their built-in functionality. This all happens without anyone noticing it, but it’s the engine that powers the new data-driven world we live in. You can’t run a modern AI system, all of which require training on large data sets, without those large data sets. In fact, many AI models are being constantly retrained on new data as developers and data scientists want to refine the models on new situations.
You can think of this being like the natural gas lines that run underneath a city. We all expect our homes to be heated to the right temperature whenever we change the thermostat, but that requires that the gas be available at all times, even when we don’t think of it. It’s only when the gas is interrupted, possibly for an extended time, that we realize something is wrong. And just as natural gas explosions are a rare, but possibly disastrous occurrence, bad data can lead to horrendously bad outcomes when an AI is improperly trained, or when a data extract goes wrong in ways that bias the data in a data lake or warehouse.
Continuing this theme of utilities, the next layer to examine is the data movement needed for local synchronization. There are two different flavors of data synchronization we will need to consider. The first one is the synchronization needed for high availability within a region. In another article, I show the most common database architectures for scalability and availability. In fact, nearly all of the architectures that feature more than one copy of the data have one thing in common — they are quite sensitive to the latency of the transfer between the database engines. This is especially true in models where the database engines all have to agree that an update has been made in all copies before the transaction completes (e.g. those models where strong consistency is upheld). In that case, the time it takes to send the updates and receive the confirmation of the update influences the overall performance of each update. The same is less true, but still true of eventual consistency models — in that case, long latency increases the possibility (which is acknowledged but never desired) that a read between two copies of the data can be inconsistent.
For that reason, almost all databases require that this kind of synchronization be done within a cloud region — that is where the data centers (Availability Zones) containing the machines in which the data is housed are all relatively physically close to one another. This may be within a metropolitan region (the original meaning of the term) or even within a few hundred kilometers. For instance, the distance between the data centers in Columbus OH and Ashburn VA (both of which have parts of AWS US-East) is about 600 km, which is more or less typical of the distances between disparate parts of an Availability Zone.
The analogy to draw here is between this kind of required data synchronization and electrical lines. In this case, if an entire data center would be lost, or would fall out of communication with the others, its loss would be felt immediately, just as you would notice an electrical outage. However, the loss would only be temporary, and may not be felt by the user, as in those models, you would switch from leader to follower, or a new quorum would constitute itself and the system would automatically balance to the new reality of fewer data centers. In this case, the operations team would be notified (and would see multiple red notices appearing on their dashboards and notifications on their pagers) but the system itself would continue functioning, albeit at reduced capacity, much as an Uninterruptible Power Supply would kick in to allow a warning and guidance to graceful shutdown on your desktop if you were plugged into one.
The next layer down is yet another synchronization layer, but this one is a bit more difficult to understand. We just mentioned that in most cases, databases have issues with latency when they are spread over distances larger than a cloud region. However, in some cases, you may still need remote synchronization for multi region availability. When your system either needs to function in multiple regions for performance reason (think of a global application like a social media platform, for instance) then you will still want to synchronize the data across region lines, usually into two or more different database instances.
In this case, you are strongly limited in how much consistency you can maintain — either one instance has to remain the follower, meaning that updates from that region will take much longer than from the home region, or you simply have to assume eventual consistency (which is much more common). For instance, Amazon RDS uses the replication features built into databases such as PostgresSQL and Oracle, to create read replicas in this way. In many cases, this kind of synchronization is not even a feature of the database — it must be carried out by software added into the architecture on top of the data layer — often by an event synchronization layer atop or as part of the microservices.
This is analogous to the water lines in a city — in our homes or offices, we may not notice at all when a water line is cut if the outage is brief enough. However, if the outage lasts long enough it becomes first annoying, then distracting and concerning, and then finally life-threatening. Given the redundancy long-distance data links, it’s rare that such an outage becomes noticeable, but when it does happen, it is very challenging to deal with, as the data in the regions begins to drift out of sync, requiring manual effort to resync.
Finally, we have the last layer, which is the least likely to be needed, but when it is needed, is absolutely essential. This layer covers the remote copying for disaster recovery, usually in the form of data backups. Sometimes this is handled by the database software itself, but more often this is something that is set up at the storage layer. Recovery from backup is usually difficult, time consuming, and will nearly always involve the loss of some data. It’s something that banks in particular have to practice regularly as part of their regulatory compliance regimes. In our analogy, this maps down to a layer we usually don’t want to think about — that is the sewer lines, particularly the ones that handle outflow from storm drains. When a storm happens, the water from the streets has to go somewhere — otherwise the city faces a catastrophe. When that catastrophe occurs, particularly in the case of natural disasters like hurricanes, floods and fires, is when data backups become important, allowing a system to be painstakingly reconstructed in a safe remote location. In many cloud services, this is now automatic. For instance, in Amazon RDS, backups are automatically taken and stored in an S3 bucket managed by AWS. The Azure SQL database does something similar, in that it automatically backs up the storage to a local storage blob that is then replicated to another region asynchronously.
Why knowledge of all of these layers is important is to know that to manage your data, there’s not just one type of data synchronization that happens — likewise, your data is not moving to just one place. You have to plan for all of these different possibilities, and be aware of the interaction of all of them on the performance and scalability of your overall system in order to design a system to meet those goals. To end with a story of why this is true, let me tell you a tale of my experience at a large retailer many years ago.
I was working with this retailer because there had been a highly publicized failure the previous year over Black Friday for which our tools and software took part of the blame. This means I was, on the day after Thanksgiving, sitting in the war room with the operations and development team while we watched the status screens to see that the fixes we had put in place over the last year would address the issues we had previously seen.
Everything went fine for the first few hours of Black Friday — I was (as I promised the team I would be) reading through the entire Lord of the Rings trilogy because things were so quiet and everything was going as expected. Suddenly, everything changed. We quickly began seeing our database utilization numbers spike, much higher than anticipated. At the same time , the operating system numbers on the database servers went way up — leading us to fear we were seeing a recurrence of the previous years problem. But the web server statistics, application server statistics and connection statistics were not indicating this was due to traffic from users — they remained obstinately fixed at the same level. This led us to believe that “The call was coming from inside the house”.
I asked the DBA if there were any additional processes running against the database that had just kicked off — he consulted his screens, and BINGO — there was an ETL extract for a daily report running that should have been turned off, but had been missed. He killed the process, the numbers went right back down to where they should have been, and I resumed reading. I closed the book at the end of “The Two Towers”, right before we went home for the night.
I’m not saying that you can always be that calm about your data architecture when disaster strikes, but knowledge of all the different layers of it will definitely help you rest easier at night, just as I did.